
Halfway through 2024: a midyear review
The New York Stock Exchange made five more bold predictions for the active ETF market in 2024:
- Assets under Management (AUM): Grow from $530 billion to exceed $750 billion by year-end 2024
- Full-year cash flow: A new high-water mark of over $150 billion
- Launch activity: 400 new active ETFs from over 100 issuers
- Growth milestone: One quarter with over $50 billion in net cash flow and one issuer with over $40 billion in cash flow for the year
- Regulatory: Either active, semi-transparent relief will see expansion to another asset class or multi-share class funds will receive approval by the SEC
So how did we do through the first half of the year?
- Assets have grown to nearly $690 billion. Given the record-breaking quarterly flows we’ve seen, we think we likely should hit our target by the end of the year.
- Q2 cash flows totaled $65 billion, breaking the previous record of $64.7 billion set last quarter. Total flows therefore sit at $129.7 billion for the first half, topping flows for all of 2023 ($125 billion) and already close to our goal for 2024.
- The industry welcomed 214 ETFs from 81 different issuers, with combined assets at the end of the quarter of $14.5 billion. If this pace of launches keeps up, we are looking good to hit our target.
- We’ve blown past the single-quarter growth target with both quarters easily passing the lofty $50 billion mark this year. This just leaves the issuer growth milestone of over $40 billion in cash flow. Dimensional remains the most likely candidate with $18.6 billion thus far. However, there will be some ground to make up if they are to pull it off this year.
- Lastly, our regulatory predictions remain questionable. While a number of additional firms have recently filed for exemptive relief to offer multi-share class funds, bringing the total at writing to 19 firms, the SEC has remained quiet on the subject. Similarly, there is still no news of expanding the semi-transparent structure to include additional asset classes or international markets.
Beyond our bold predictions, here are a few additional stats from the quarter that stood out to us:
- Active ETF cash flow as a percentage of total ETF industry cash flow: 31%, up from 28% last quarter, and just below the high of 33% experienced in Q1 of 2023.
- Firms with postive cash flow: 214 firms, or over 75% of all issuers; up 5% from last quarter and on par with the end of 2023.
- ETFs with postive cash flow: 1,019 ETFs, or nearly 68% of all Active ETFs; up 3% from last quarter and well above Q4 2023’s 50%.
- Active ETF launches as a percentage of total ETF launches: 72%; across all US listed ETFs, 41% are now actively managed.
Quarterly Active ETF Flows
Source: Factset as of 06/30/2024
Annual Active ETF Flows
Source: Factset as of 06/30/2024
Quarterly Active CF Share
Source: Factset as of 06/30/2024
2024 is off to a powerful start with back-to-back record-breaking quarters for cash flows. After reaching new heights at the end of 2023 with $46.8 billion in cash flows, we set our next milestone at what we thought was a lofty $50 billion. We easily exceeded that with $64.7 billion in Q1 and have now sneaked past that with $65 billion in Q2. Combined, the first half of this year has already seen inflows that have topped all of 2023. While market performance has a significant role in this, we are seeing that investor appetite for actively managed ETFs is clearly continuing to grow. At the current rate, we could see inflows reach $250 billion by year-end — more than double the previous record. This elevated growth is also apparent in two other ways: the percent of cash flows that have gone into Active ETFs this year (31%) and the percent of launches that have been Active ETFs (72%).
Active ETF Fund Flows by Asset Class
Source: Factset as of 06/30/2024
Asset Class Leaders
| Global Equity | Domestic Equity | Domestic Fixed Income | Global Fixed Income | Commodities | Asset Allocation | Alternatives | Currency | |
|---|---|---|---|---|---|---|---|---|
| AUM Leader | Dimensional | Dimensional | JPMorgan | First Trust | Invesco | WisdomTree | First Trust | ProShares |
| AUM Leader $B | $44.4 | $86.1 | $30.5 | $18.0 | $5.2 | $1.5 | $1.7 | $1.9 |
| H1 CF Leader | Dimensional | JPMorgan | JPMorgan | Janus | Invesco | Capital Group | Simplify | Volatility Shares |
| H1 CF Leader $B | $6.7 | $9.7 | $2.8 | $5.9 | $0.26 | $0.4 | $0.6 | $0.66 |
Source: Factset as of 06/30/2024
For the first time since Q2 2022, we saw the actively managed ETF industry grow across all asset classes. Equity flows continued to drive the industry, leading the way with $78.9 billion. Investors favored domestic equity exposure (+$65.4 billion) to global (+$13.5 billion). Notably, those ETFs that focused on income either via dividends or options overlays, core exposures and/or offered an options overlay to limit downside risk led the way in cash flows. Fixed income flows (+$42.5 billion) continued to favor global exposures (+$25 billion) to domestic (+$17.5 billion). For global exposures, investors demonstrated ongoing interest in Core+/Go-Anywhere strategies along with Janus Henderson’s CLO ETF (JAAA, +$5.2 billion). For domestic exposures, short term/cash alternatives, municipal and MBS strategies remained in favor. Asset Allocation, (+$1.5 billion) started to gain some traction in a positive direction, with Capital Group’s Core Balanced ETF (+$0.4 billion) leading the charge. Alternatives (+$1.4 billion) also picked up some flows, carried by Simplify’s Volatility Premium ETF (+$0.4 billion) and First Trust’s Long/Short Equity ETF (+$0.4 billion). Commodities (+$0.2 billion) and Currency (+$0.3 billion) had the least inflows but were notably still positive — reversing the trend of recent years.
H1 2024 Cash Flow Leaders by Asset Class
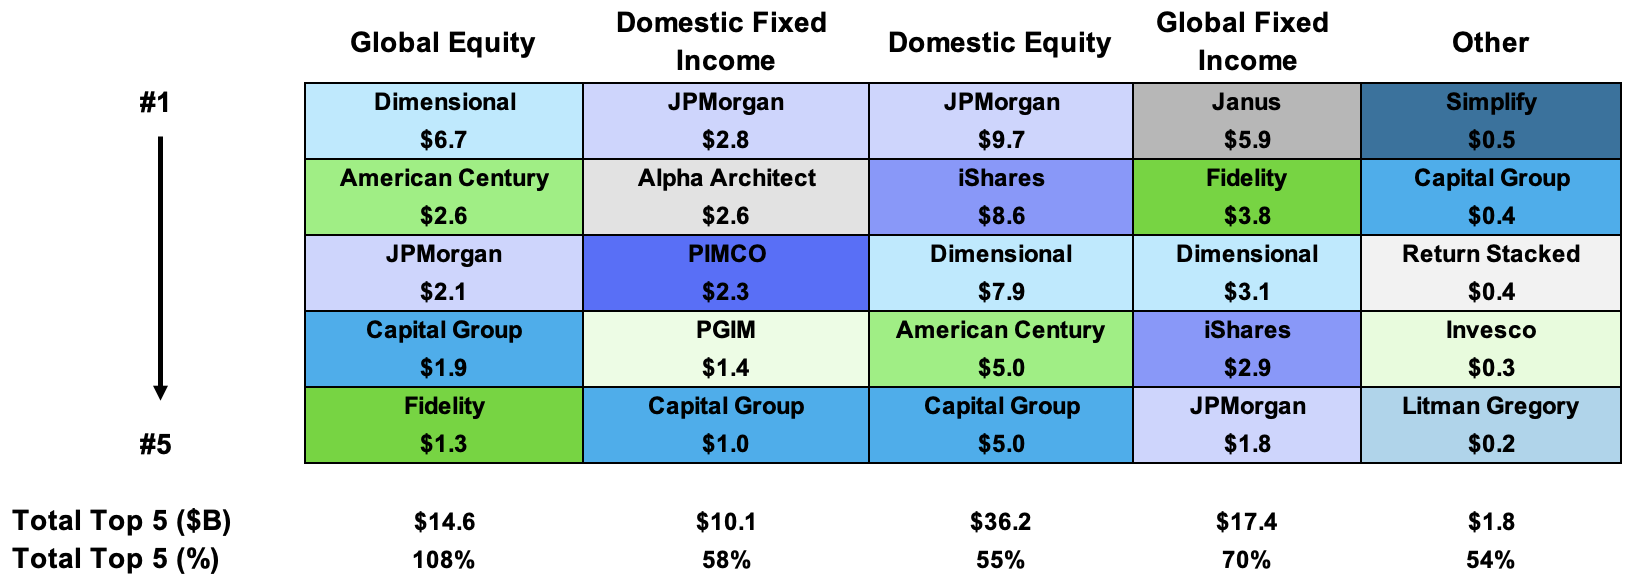
At the issuer level, Dimensional and JP Morgan remain locked in a battle for the crown of cash flows. Dimensional is slightly ahead in total cash flows with $18.6 billion. However, JP Morgan isn’t far behind at $16.4 billion. In third place, iShares sits at $10.7 billion. Dimensional maintains consistency with positive flows in all but one of its ETFs — whereas JP Morgan has four ETFs with over $2 billion in net cash flows, with JEPQ itself taking in $5.5 billion. Dimensional remains on top for Global Equity, while JP Morgan has risen to the top of both Domestic Equity and Domestic Fixed Income this quarter led by JEPQ, JEPI and JPST. Also notable in those asset classes is Capital Group, who now sits at the #5 spot in both categories. Janus, led by JAAA (+$5.2 billion), still leads in Global Fixed Income. Across the four largest asset classes, American Century (+$7.9 billion), iShares (+$10.7 billion) and Fidelity (+$6.2 billion) continue to take multiple spots in the top 5s. Lastly, in the Other category aggregating Alternatives, Asset Allocation, Commodities, and Currencies, Simplify (+$1.5 billion) now leads the group with SVOL (+$0.4 billion) doing the heavy lifting. Another notable figure is the number of firms that have more than $2 billion in cash flows halfway through the year. 15 firms now sit above this threshold, triple the number at the same point last year. Aside from the firms already mentioned above, FT/Vest (+$4.4 billion), GraniteShares (+$3.6 billion), PIMCO (+$3.4 billion), YieldMax (+$2.8 billion), Alpha Architect (+$2.7 billion), T. Rowe Price (+$2.5 billion) and Envestnet (+$2.1 billion) also made this list. For each of these firms, their leading ETFs by cash flow are: FT Vest Laddered Buffer ETF (BUFR, +$1.3 billion), GraniteShares 1.5x Long NVDA Daily ETF (NVDL, +$2.7 billion), PIMCO Enhanced Short Maturity Active ETF (MINT, +$1.7 billion), YieldMax COIN Option Income Strategy ETF (CONY, +$0.5 billion), Alpha Architect 1-3 Month Box ETF (BOXX, +$2.6 billion), T. Rowe Price Capital Appreciation Equity ETF (TCAF, +$0.9 billion), and ActivePassive U.S. Equity ETF (APUE, +$1.0 billion).
| Ticker | Top 10 ETFs by Cash Flow | H1 2024 ($M) |
|---|---|---|
| DYNF | BlackRock U.S. Equity Factor Rotation ETF | $8,829 |
| JEPQ | J.P. Morgan Nasdaq Equity Premium Income ETF | $5,484 |
| JAAA | Janus Detroit Street Trust Janus Henderson AAA CLO ETF | $5,221 |
| FBND | Fidelity Total Bond ETF | $3,335 |
| BINC | BlackRock Flexible Income ETF | $2,837 |
| NVDL | GraniteShares 1.5x Long NVDA Daily ETF | $2,733 |
| BOXX | Alpha Architect 1-3 Month Box ETF | $2,621 |
| CGDV | Capital Group Dividend Value ETF | $2,543 |
| AVUV | Avantis U.S. Small Cap Value ETF | $2,368 |
| JEPI | JPMorgan Equity Premium Income ETF | $2,265 |
Source: Factset as of 06/30/2024
| Ticker | Bottom 10 ETFs by Cash Flow | H1 2024 ($M) |
|---|---|---|
| ARKK | ARK Innovation ETF | $(1,964) |
| FTSM | First Trust Enhanced Short Maturity ETF | $(872) |
| ICSH | BlackRock Ultra Short-Term Bond ETF | $(644) |
| BLOK | Amplify Transformational Data Sharing ETF | $(545) |
| PJUL | Innovator U.S. Equity Power Buffer ETF - July | $(429) |
| LCTU | BlackRock U.S. Carbon Transition Readiness ETF | $(419) |
| PAUG | Innovator U.S. Equity Power Buffer ETF - August | $(388) |
| ARKW | ARK Next Generation Internet ETF | $(353) |
| ARKG | ARK Genomic Revolution ETF | $(318) |
| UAUG | Innovator U.S. Equity Ultra Buffer ETF - August | $(318) |
Source: Factset as of 06/30/2024
Through Q2, over 75% of issuers and 68% of Active ETFs experienced positive cash flows, highlighting the healthy state of the actively managed ETF industry. Additionally, almost a fourth of ETFs had cash flows above $50 million (often viewed as a general break-even measure for an ETF); up 5% year over year.
| Expense Ratio | 6/30/2024 AUM | H1 2024 CF | % AUM | % CF | # ETFs |
|---|---|---|---|---|---|
| 0-25 | $ 237,660,656,312 | $ 36,540,478,554 | 34% | 29% | 150 |
| 26-50 | $ 247,606,309,776 | $ 59,422,146,777 | 36% | 48% | 346 |
| 51-75 | $92,490,519,639 | $ 12,550,635,866 | 13% | 10% | 381 |
| 76+ | $ 111,189,186,896 | $ 16,315,395,324 | 16% | 13% | 613 |
| Expense Ratio | 6/30/2023 AUM | H1 2023 CF | % AUM | % CF | # ETFs |
|---|---|---|---|---|---|
| 0-25 | $ 151,427,814,429 | $ 17,245,240,566 | 36% | 33% | 106 |
| 26-50 | $ 133,445,455,355 | $ 28,037,261,315 | 32% | 53% | 234 |
| 51-75 | $ 67,365,553,837 | $ 3,539,885,351 | 16% | 7% | 273 |
| 76+ | $ 69,058,013,698 | $ 4,187,760,283 | 16% | 8% | 402 |
The industry’s asset weighted expense ratio ticked up to 0.43% through the quarter (up from 0.42% in Q1). Nearly 70% of all cash flows this year have gone into ETFs with expense ratios below the industry average. However, year over year, cash flow increased into ETFs with expense ratios above the industry average. This is largely the result of an increased use of structured products ETFs that either seek downside protection or deliver access to single stocks/ETFs while providing income or leverage. Only 30 of the 214 (14%) ETFs launched during this year offered an expense ratio equal to or below the industry average.
Source: Factset as of 3/31/2024
H1 2024 Launch Monitor
Domestic Equity
111 ETFs Launched
$4.1 B Assets Raised
Domestic Fixed Income
22 ETFs Launched
$1.6 B Assets Raised
Asset Allocation
8 ETFs Launched
$765 M Assets Raised
Global Equity
46 ETFs Launched
$5.4 B Assets Raised
Global Fixed Income
18 ETFs Launched
$2.5 B Assets Raised
Other
9 ETFs Launched
$205 M Assets Raised
Source: FactSet as of 06/30/2024, figures include MF-ETF conversions; Other includes Alternative, Commodities & Currencies
In the first half of 2024, 214 actively managed ETFs launched, raising $14.5 billion in assets. Launches came from 81 different issuers, including 28 first-time issuers. ETF development continued to focus on equities, with nearly 75% of new ETFs focused on the asset class. During the quarter, PGIM launched the most ETFs (28), and Eagle Capital ($1.8 billion via conversion) raised the most assets.
As the industry enters the second half of the year, we will be keeping a watchful eye on the record setting pace of active ETF adoption and how our five bold predictions for 2024 are playing out.
Q2 2024 ETF Launches
| Ticker | Name | Issuer | Launch Date | Asset Class | AUM |
|---|---|---|---|---|---|
| PBAP | PGIM US Large-Cap Buffer 20 ETF - April | PGIM | 4/1/24 | Equity | $6,435,776 |
| APRP | PGIM US Large-Cap Buffer 12 ETF - April | PGIM | 4/1/24 | Equity | $4,923,002 |
| AAPR | Innovator Equity Defined Protection ETF - 2 Yr to April 2026 | Innovator | 4/1/24 | Equity | $77,134,500 |
| HAPR | Innovator Premium Income 9 Buffer ETF - April | Innovator | 4/1/24 | Equity | $1,877,250 |
| LAPR | Innovator Premium Income 15 Buffer ETF - April | Innovator | 4/1/24 | Fixed Income | $3,751,500 |
| ARLU | AllianzIM U.S. Equity Buffer15 Uncapped Apr ETF | Allianz Investment Management | 4/1/24 | Equity | $22,504,388 |
| FLAO | AllianzIM U.S. Equity 6 Month Floor5 Apr/Oct ETF | Allianz Investment Management | 4/1/24 | Equity | $73,635,735 |
| EHLS | Even Herd Long Short ETF | Even Herd | 4/2/24 | Alternatives | $45,733,690 |
| KOOL | North Shore Equity Rotation ETF | Split Rock | 4/2/24 | Equity | $36,714,600 |
| RVER | Trenchless Fund ETF | River1 | 4/3/24 | Equity | $45,486,298 |
| CNEQ | Alger Concentrated Equity ETF | Alger | 4/5/24 | Equity | $5,276,585 |
| ALAI | Alger AI Enablers & Adopters ETF | Alger | 4/5/24 | Equity | $7,177,755 |
| RAYJ | Rayliant SMDAM Japan Equity ETF | Rayliant Asset Management | 4/5/24 | Equity | $31,852,857 |
| SAMM | Strategas Macro Momentum ETF | Strategas | 4/5/24 | Equity | $9,455,106 |
| STBF | Performance Trust Short Term Bond ETF | Performance Trust | 4/9/24 | Fixed Income | $11,555,200 |
| MDST | Westwood Salient Enhanced Midstream Income ETF | Westwood | 4/9/24 | Equity | $43,593,455 |
| OGSP | Obra High Grade Structured Products ETF | Obra | 4/10/24 | Fixed Income | $25,776,640 |
| OOSP | Obra Opportunistic Structured Products ETF | Obra | 4/10/24 | Fixed Income | $15,958,000 |
| FBUF | Fidelity Dynamic Buffered Equity ETF | Fidelity | 4/11/24 | Equity | $6,390,300 |
| FHEQ | Fidelity Hedged Equity ETF | Fidelity | 4/11/24 | Equity | $459,851,693 |
| FYEE | Fidelity Yield Enhanced Equity ETF | Fidelity | 4/11/24 | Equity | $5,725,463 |
| NEWZ | StockSnips AI-Powered Sentiment US All Cap ETF | StockSnips | 4/12/24 | Equity | $11,995,788 |
| CCSB | Carbon Collective Short Duration Green Bond ETF | Carbon Collective | 4/12/24 | Fixed Income | $11,612,125 |
| XAPR | FT Vest U.S. Equity Enhance & Moderate Buffer ETF - April | First Trust | 4/22/24 | Equity | $14,736,272 |
| QCAP | FT Vest Nasdaq-100 Conservative Buffer ETF - April | First Trust | 4/22/24 | Equity | $29,610,042 |
| YBIT | YieldMax Bitcoin Option Income Strategy ETF | YieldMax | 4/23/24 | Currency | $36,996,750 |
| MAYP | PGIM US Large-Cap Buffer 12 ETF - May | PGIM | 5/1/24 | Equity | $3,424,733 |
| PBMY | PGIM US Large-Cap Buffer 20 ETF - May | PGIM | 5/1/24 | Equity | $4,687,730 |
| MAYU | AllianzIM U.S. Equity Buffer15 Uncapped May ETF | Allianz Investment Management | 5/1/24 | Equity | $14,012,618 |
| ERNZ | TrueShares Active Yield ETF | TrueMark | 5/1/24 | Equity | $148,177,520 |
| PSTR | Peakshares Sector Rotation ETF | Peakshares | 4/29/24 | Equity | $7,305,536 |
| WEEI | Westwood Salient Enhanced Energy Income ETF | Westwood | 5/1/24 | Equity | $13,082,245 |
| TOGA | Tremblant Global ETF | Global X | 5/3/24 | Equity | $102,576,800 |
| CRSH | YieldMax Short TSLA Option Income Strategy ETF | YieldMax | 5/2/24 | Equity | $9,515,625 |
| JHHY | John Hancock High Yield ETF | John Hancock | 5/2/24 | Fixed Income | $30,250,800 |
| AGGS | Harbor Disciplined Bond ETF | Harbor | 5/2/24 | Fixed Income | $28,655,270 |
| SIXZ | AllianzIM U.S. Large Cap 6 Month Buffer10 May/Nov ETF | Allianz Investment Management | 5/1/24 | Equity | $7,827,390 |
| CPSM | Calamos S&P 500 Structured Alt Protection ETF | Calamos | 5/1/24 | Equity | $116,889,526 |
| IMAY | Innovator International Developed Power Buffer ETF - May | Innovator | 5/1/24 | Equity | $10,175,120 |
| JULP | PGIM US Large-Cap Buffer 12 ETF - July | PGIM | 5/8/24 | Equity | $2,041,226 |
| PBJL | PGIM US Large-Cap Buffer 20 ETF - July | PGIM | 5/8/24 | Equity | $1,526,125 |
| AUGP | PGIM US Large-Cap Buffer 12 ETF - August | PGIM | 5/10/24 | Equity | $2,043,202 |
| PBAU | PGIM US Large-Cap Buffer 20 ETF - August | PGIM | 5/10/24 | Equity | $1,783,653 |
| USOY | Defiance Oil Enhanced Options Income ETF | Defiance ETFs | 5/10/24 | Commodities | $2,479,725 |
| EIPI | FT Energy Income Partners Enhanced Income ETF | First Trust | 5/6/24 | Equity | $969,555,333 |
| AIFD | TCW Artificial Intelligence ETF | TCW | 5/6/24 | Equity | $63,137,164 |
| GRW | TCW Compounders ETF | TCW | 5/6/24 | Equity | $191,006,168 |
| NDOW | Anydrus Advantage ETF | Anydrus | 5/14/24 | Asset Allocation | $34,210,413 |
| PBSE | PGIM US Large-Cap Buffer 20 ETF - September | PGIM | 5/15/24 | Equity | $1,781,490 |
| SEPP | PGIM US Large-Cap Buffer 12 ETF - September | PGIM | 5/15/24 | Equity | $2,296,934 |
| OCTP | PGIM US Large-Cap Buffer 12 ETF - October | PGIM | 5/17/24 | Equity | $3,055,189 |
| PBOC | PGIM US Large-Cap Buffer 20 ETF - October | PGIM | 5/17/24 | Equity | $1,524,409 |
| LRGG | Macquarie Focused Large Growth ETF | Macquarie | 5/15/24 | Equity | $11,945,250 |
| ASMF | Virtus Alphasimplex Managed Futures ETF | Virtus | 5/16/24 | Alternatives | $7,663,722 |
| WEEL | Peerless Option Income Wheel ETF | Peerless ETFs | 5/16/24 | Equity | $4,038,820 |
| JADE | JPMorgan Active Developing Markets Equity ETF | JPMAM | 5/17/24 | Equity | $14,325,810 |
| QMMY | FT Vest Nasdaq-100 Moderate Buffer ETF - May | First Trust | 5/20/24 | Equity | $104,537,801 |
| XMAY | FT Vest U.S. Equity Enhance & Moderate Buffer ETF - May | First Trust | 5/20/24 | Equity | $41,455,623 |
| NOVP | PGIM US Large-Cap Buffer 12 ETF - November | PGIM | 5/22/24 | Equity | $2,287,924 |
| PBNV | PGIM US Large-Cap Buffer 20 ETF - November | PGIM | 5/22/24 | Equity | $6,591,675 |
| DECP | PGIM US Large-Cap Buffer 12 ETF - December | PGIM | 5/24/24 | Equity | $5,360,822 |
| PBDE | PGIM US Large-Cap Buffer 20 ETF - December | PGIM | 5/24/24 | Equity | $1,526,197 |
| OZEM | Roundhill GLP-1 & Weight Loss ETF | Roundhill | 5/21/24 | Equity | $33,046,000 |
| GENM | Genter Capital Municipal Quality Intermediate ETF | Genter Capital Management | 5/22/24 | Fixed Income | $912,600 |
| GENT | Genter Capital Taxable Quality Intermediate ETF | Genter Capital Management | 5/22/24 | Fixed Income | $20,553,750 |
| OCFS | Otter Creek Focus Strategy ETF | Otter Creek | 5/20/24 | Equity | $2,749,259 |
| GDXY | YieldMax Gold Miners Option Income Strategy ETF | YieldMax | 5/21/24 | Equity | $6,140,518 |
| RSSY | Return Stacked U.S. Stocks & Futures Yield ETF | Return Stacked | 5/29/24 | Asset Allocation | $130,836,740 |
| MFUT | Cambria Chesapeake Pure Trend ETF | Cambria | 5/29/24 | Asset Allocation | $22,183,500 |
| BUFS | FT Vest Laddered Small Cap Moderate Buffer ETF | First Trust | 5/30/24 | Equity | $2,993,125 |
| SECR | IQ MacKay Securitzed Income ETF | IndexIQ | 5/31/24 | Fixed Income | $123,882,765 |
| URAX | Defiance Daily Target 2x Long Uranium ETF | Defiance ETFs | 5/28/24 | Equity | $1,198,688 |
| RTRE | Rareview Total Return Bond ETF | Rareview Funds | 6/3/24 | Fixed Income | $20,488,192 |
| JUNP | PGIM US Large-Cap Buffer 12 ETF - June | PGIM | 6/3/24 | Equity | $8,708,513 |
| PBJN | PGIM US LARGE-CAP BUFFER 20 ETF - JUNE | PGIM | 6/3/24 | Equity | $6,123,254 |
| KJUN | Innovator U.S. Small Cap Power Buffer ETF - June | Innovator | 6/3/24 | Equity | $10,087,920 |
| NJUN | Innovator Growth-100 Power Buffer ETF - June | Innovator | 6/3/24 | Equity | $34,232,833 |
| JNEU | AllianzIM U.S. Equity Buffer15 Uncapped June ETF | Allianz Investment Management | 6/3/24 | Equity | $12,850,000 |
| ETHU | 2x Ether ETF | Volatility Shares | 6/4/24 | Currency | $56,959,200 |
| AIPI | REX AI Equity Premium Income ETF | REX Shares | 6/4/24 | Equity | $9,525,250 |
| BGRO | BlackRock Large Cap Growth ETF | iShares | 6/5/24 | Equity | $5,707,890 |
| METU | Direxion Daily META Bull 2X Shares | Direxion Shares | 6/5/24 | Equity | $6,895,028 |
| METD | Direxion Daily META Bear 1X Shares | Direxion Shares | 6/5/24 | Equity | $2,947,624 |
| CPNJ | Calamos Nasdaq - 100 Structured Alt Protection ETF -June | Calamos | 6/3/24 | Equity | $58,210,937 |
| SIXD | AllianzIM U.S. Large Cap 6 Month Buffer10 Jun/Dec ETF | Allianz Investment Management | 6/3/24 | Equity | $168,766,575 |
| IJUN | Innovator International Developed Power Buffer ETF- June | Innovator | 6/3/24 | Equity | $19,328,500 |
| BUFP | PGIM Laddered Fund of Buffer 12 ETF | PGIM | 6/13/24 | Equity | $17,160,684 |
| PBFR | PGIM Laddered Fund of Buffer 20 ETF | PGIM | 6/13/24 | Equity | $13,624,200 |
| QXQ | SGI Enhanced Nasdaq 100 ETF | Summit Global | 6/14/24 | Equity | $4,805,366 |
| OASC | OneAscent Small Cap Core ETF | OneAscent Investment Solutions | 6/13/24 | Equity | $5,622,750 |
| SNOY | YieldMax SNOW Option Income Strategy ETF | YieldMax | 6/11/24 | Equity | $3,688,495 |
| SDFI | AB Short Duration Income ETF | AllianceBernstein | 6/10/24 | Fixed Income | $101,702,712 |
| SYFI | AB Short Duration High Yield ETF | AllianceBernstein | 6/10/24 | Fixed Income | $673,123,394 |
| BELT | BlackRock Long-Term U.S. Equity ETF | iShares | 6/18/24 | Equity | $6,326,250 |
| BRHY | BlackRock High Yield ETF | iShares | 6/18/24 | Fixed Income | $100,906,800 |
| EVSD | Eaton Vance Short Duration Income ETF | Morgan Stanley | 6/17/24 | Fixed Income | $186,878,971 |
| GLOW | VictoryShares WestEnd Global Equity ETF | VictoryShares | 6/21/24 | Equity | $2,501,830 |
| BMDL | VictoryShares WestEnd Economic Cycle Bond ETF | VictoryShares | 6/21/24 | Fixed Income | $55,362,450 |
| QQQT | Defiance Nasdaq 100 Income Target ETF | Defiance ETFs | 6/21/24 | Equity | $4,977,500 |
| JUNM | FT Vest U.S. Equity Max Buffer ETF - June | First Trust | 6/24/24 | Equity | $42,770,061 |
| XIJN | FT Vest U.S. Equity Buffer & Premium Income ETF - June | First Trust | 6/24/24 | Equity | $1,528,526 |
| IWMI | NEOS Russell 2000 High Income ETF | Neos | 6/25/24 | Equity | $1,000,400 |
| PMIO | PGIM Municipal Income Opportunities ETF | PGIM | 6/28/24 | Fixed Income | $25,138,250 |
| PUSH | PGIM Ultra Short Municipal Bond ETF | PGIM | 6/28/24 | Fixed Income | $25,072,350 |
| CGCV | Capital Group Conservative Equity ETF | Capital Group | 6/27/24 | Equity | $12,048,841 |
| CGGE | Capital Group Global Equity ETF | Capital Group | 6/27/24 | Equity | $10,095,516 |
| CGIB | Capital Group International Bond ETF (USD-Hedged) | Capital Group | 6/27/24 | Fixed Income | $49,381,200 |
| CGIC | Capital Group International Core Equity ETF | Capital Group | 6/27/24 | Equity | $10,058,509 |
| CGHM | Capital Group Municipal High-Income ETF | Capital Group | 6/27/24 | Fixed Income | $20,032,000 |
| CGNG | Capital Group New Geography Equity ETF | Capital Group | 6/27/24 | Equity | $10,079,800 |
| CGUI | Capital Group Ultra Short Income ETF | Capital Group | 6/27/24 | Fixed Income | $30,054,000 |
| NBFC | Neuberger Berman Flexible Credit Income ETF | Neuberger Berman | 6/25/24 | Fixed Income | $50,052,850 |
| ABNY | YieldMax ABNB Option Income Strategy ETF | YieldMax | 6/25/24 | Equity | $2,560,913 |
| TIME | Clockwise Core Equity & Innovation ETF | Clockwise Capital | 6/24/24 | Equity | $23,740,063 |
| NITE | Nightview Fund NITE | Nightview | 6/24/24 | Equity | $17,481,427 |
| NBSD | Neuberger Berman Short Duration Income ETF | Neuberger Berman | 6/24/24 | Fixed Income | $143,732,809 |
| RSJN | FT Vest U.S. Equity Equal Weight Buffer ETF - June | First Trust | 6/24/24 | Equity | $3,018,060 |
| FLXR | TCW Flexible Income ETF | TCW | 6/24/24 | Fixed Income | $91,638,000 |
| Total - 118 New ETFs | Total | $5,530,009,991 |
Source: FactSet & NYSE Internal Database and Consolidated Tape Statistics as of 6/30/2024
Active ETF Stat Pack
| Firms | |||
|---|---|---|---|
| # of Issuers | 285 | ||
| # of New Issuers 2023 | 28 | ||
| Products | Assets | ||
| # of ETFs | 1490 | AUM ($B) | $688.95 |
| # of New Launches 2023 | 214 | 3 Yr AUM CAGR | 38% |
| Avg. ER | 0.43% | 5 Yr AUM CAGR | 53% |
| Cash Flow | Trading | ||
| YTD Cash Flow ($B) | $129.74 | YTD ADV (Shares) | 231,499,717 |
| 3 Yr Cash Flow | $371.03 | YTD ADV ($) | $6.83 B |
| 5 Yr Cash Flow | $503.45 | YTD Avg. Spread (bps)* | 24.72 |
Source: FactSet & NYSE Internal Database and Consolidated Tape Statistics as of 6/30/2024
*Simple average
Active, Semi-Transparent ETFs
| Ticker | Inception | Name | AUM | YTD Flows | 30 Day Median Spread (bps) | ADV (shares) | Structure | LMM | Expense Ratio |
|---|---|---|---|---|---|---|---|---|---|
| VNSE | 9/17/20 | Natixis Vaughan Nelson Select ETF | $33,330,267 | -$1,001,631 | 14.56 | 2,538 | NYSE AMS | Citadel | 0.80% |
| VNMC | 9/17/20 | Natixis Vaughan Nelson Mid Cap ETF | $4,160,566 | $367,708 | 21.42 | 251 | NYSE AMS | Citadel | 0.85% |
| ESGA | 7/15/20 | American Century Sustainable Equity ETF | $254,406,864 | $52,491,637 | 11.57 | 14,236 | NYSE AMS | Citadel | 0.39% |
| MID.ETF | 7/15/20 | American Century Mid Cap Growth Impact ETF | $70,116,795 | $7,263,026 | 11.91 | 4,033 | NYSE AMS | Citadel | 0.45% |
| ESGY | 7/1/21 | American Century Sustainable Growth ETF | $16,950,428 | $1,499,310 | 11.03 | 1,426 | NYSE AMS | Citadel | 0.39% |
| NDVG | 8/5/21 | Nuveen Dividend Growth ETF | $10,604,369 | -$3,209,127 | 8.47 | 3,573 | NYSE AMS | Citadel | 0.65% |
| NSCS | 8/5/21 | Nuveen Small Cap Select ETF | $6,943,773 | $257,177 | 11.51 | 345 | NYSE AMS | Citadel | 0.86% |
| NWLG | 8/5/21 | Nuveen Winslow Large-Cap Growth ESG ETF | $8,652,392 | $600,721 | 8.85 | 695 | NYSE AMS | Citadel | 0.65% |
| SAEF | 11/16/21 | Schwab Ariel ESG ETF | $21,830,000 | $1,729,850 | 34.48 | 2,335 | NYSE AMS | Flow Traders | 0.59% |
| IWLG | 6/23/22 | IQ Winslow Large Cap Growth ETF | $41,657,490 | $11,954,100 | 21.94 | 3,577 | NYSE AMS | Citadel | 0.60% |
| IWFG | 6/23/22 | IQ Winslow Focused Large Cap Growth ETF | $11,924,900 | $2,157,590 | 23.10 | 486 | NYSE AMS | Citadel | 0.65% |
| TSME | 10/5/22 | Thrivent Small-Mid Cap ESG ETF | $168,636,075 | -$2,894,093 | 7.49 | 52,032 | NYSE AMS | RBC | 0.65% |
| JPSV | 3/8/23 | JPMorgan Active Small Cap Value ETF | $13,015,200 | -$1,376,700 | 8.21 | 1,159 | NYSE AMS | Citadel | 0.74% |
| LSGR | 6/29/23 | Natixis Loomis Sayles Focused Growth ETF | $177,230,185 | $156,719,826 | 12.37 | 40,041 | NYSE AMS | Citadel | 0.59% |
| SGLC | 3/31/23 | SGI U.S. Large Cap Core ETF | $86,658,908 | -$30,806,875 | 10.26 | 20,895 | NYSE AMS | GTS | 0.85% |
| FDG | 4/2/20 | American Century Focused Dynamic Growth ETF | $234,818,307 | $1,618,561 | 10.40 | 11,566 | NYSE AMS | Citadel | 0.45% |
| FLV | 4/2/20 | American Century Focused Large Cap Value ETF | $211,825,176 | -$4,758,191 | 10.36 | 8,050 | NYSE AMS | Citadel | 0.42% |
| FBCG | 6/4/20 | Fidelity Blue Chip Growth ETF | $1,915,840,313 | $541,650,822 | 9.22 | 385,783 | Fidelity Proxy | GTS | 0.59% |
| FBCV | 6/4/20 | Fidelity Blue Chip Value ETF | $119,254,309 | -$4,513,258 | 16.35 | 15,329 | Fidelity Proxy | GTS | 0.59% |
| FFLC | 6/4/20 | Fidelity New Millennium ETF | $351,654,469 | $132,891,131 | 12.16 | 59,253 | Fidelity Proxy | GTS | 0.38% |
| FFLG | 2/4/21 | Fidelity Growth Opportunities ETF | $324,768,867 | $28,477,316 | 12.98 | 57,946 | Fidelity Proxy | Citadel | 0.38% |
| FMAG | 2/4/21 | Fidelity Magellan ETF | $114,579,596 | $44,210,355 | 7.68 | 41,060 | Fidelity Proxy | RBC | 0.59% |
| FPRO | 2/4/21 | Fidelity Real Estate Investment ETF | $11,871,500 | -$1,515,089 | 13.71 | 2,323 | Fidelity Proxy | Citadel | 0.59% |
| FFSM | 2/4/21 | Fidelity Small/Mid-Cap Opportunities ETF | $67,890,533 | $21,770,727 | 6.98 | 18,701 | Fidelity Proxy | RBC | 0.43% |
| FSST | 6/17/21 | Fidelity Sustainability U.S. Equity ETF | $13,474,418 | $600,502 | 11.27 | 2,282 | Fidelity Proxy | RBC | 0.59% |
| FDWM | 6/17/21 | Fidelity Women's Leadership ETF | $4,458,093 | $531,042 | 10.31 | 1,277 | Fidelity Proxy | RBC | 0.59% |
| TCHP | 8/5/20 | T. Rowe Price Blue Chip Growth ETF | $710,267,186 | $112,067,332 | 10.08 | 96,197 | T Rowe Proxy | Virtu | 0.57% |
| TDVG | 8/5/20 | T. Rowe Price Dividend Growth ETF | $618,501,489 | $234,477,211 | 6.96 | 87,114 | T Rowe Proxy | RBC | 0.50% |
| TEQI | 8/5/20 | T. Rowe Price Equity Income ETF | $191,184,419 | $41,691,332 | 12.24 | 18,472 | T Rowe Proxy | Virtu | 0.54% |
| TGRW | 8/5/20 | T. Rowe Price Growth Stock ETF | $221,889,443 | $139,398,395 | 6.67 | 34,023 | T Rowe Proxy | RBC | 0.52% |
| TSPA | 6/8/21 | T. Rowe Price U.S. Equity Research ETF | $712,781,611 | $574,275,771 | 9.39 | 145,324 | T Rowe Proxy | RBC | 0.34% |
| IVRA | 12/22/20 | Invesco Real Assets ESG ETF | $5,244,024 | $1,927,000 | 46.02 | 2,623 | Fidelity Proxy | Citadel | 0.59% |
| LOPP | 2/1/21 | Gabelli Love Our Planet & People ETF | $11,326,200 | -$799,740 | 33.69 | 427 | ActiveShares | GTS | 0.00% |
| GGRW | 2/16/21 | Gabelli Growth Innovators ETF | $5,892,390 | $1,426,370 | 34.71 | 3,561 | ActiveShares | GTS | 0.90% |
| GAST | 1/5/22 | Gabelli Asset ETF | $4,825,050 | $0 | 35.29 | 33 | ActiveShares | GTS | 0.90% |
| GABF | 5/11/22 | Gabelli Financial Services Opportunities ETF | $14,674,660 | $3,783,740 | 23.85 | 3,211 | ActiveShares | GTS | 0.10% |
| GCAD | 1/3/23 | Gabelli Commercial Aerospace & Defense ETF | $5,508,825 | $577,570 | 25.66 | 665 | ActiveShares | GTS | 0.00% |
| FRTY | 3/1/21 | Alger Mid Cap 40 ETF | $37,195,600 | $3,785,538 | 64.13 | 11,157 | ActiveShares | Virtu | 1.19% |
| ATFV | 5/4/21 | Alger 35 ETF | $19,691,750 | $3,113,825 | 52.60 | 5,783 | ActiveShares | Virtu | 1.83% |
| AWEG | 3/7/23 | Alger Weatherbie Enduring Growth ETF | $4,714,000 | $0 | 64.24 | 52 | ActiveShares | Virtu | 1.25% |
| CLIA | 5/9/23 | Veridien Climate Action ETF | $25,511,464 | $1,734,293 | 54.08 | 2,550 | ActiveShares | GTS | 0.85% |
| REIT | 2/26/21 | ALPS Active REIT ETF | $25,581,650 | $6,809,600 | 18.42 | 6,537 | Blue Tractor | GTS | 0.68% |
| STNC | 3/16/21 | Hennessy Stance ESG Large Cap ETF | $112,626,868 | $49,432,655 | 46.46 | 6,017 | Blue Tractor | GTS | 0.85% |
| DYTA | 3/30/23 | SGI Dynamic Tactical ETF | $58,161,322 | -$56,942,160 | 18.15 | 27,024 | Blue Tractor | GTS | 1.04% |
| PFUT | 5/26/21 | Putnam Sustainable Future ETF | $281,427,580 | $44,483,869 | 15.59 | 30,935 | Fidelity Proxy | Virtu | 0.64% |
| PLDR | 5/26/21 | Putnam Sustainable Leaders ETF | $552,812,851 | $37,813,552 | 10.19 | 46,288 | Fidelity Proxy | RBC | 0.59% |
| PGRO | 5/26/21 | Putnam Focused Large Cap Growth ETF | $64,153,165 | $6,430,894 | 9.48 | 9,198 | Fidelity Proxy | RBC | 0.56% |
| PVAL | 5/26/21 | Putnam Focused Large Cap Value ETF | $664,223,880 | $357,984,737 | 6.59 | 159,189 | Fidelity Proxy | Virtu | 0.56% |
| HFGO | 11/9/21 | Hartford Large Cap Growth ETF | $129,879,980 | $112,730 | 16.68 | 1,329 | Fidelity Proxy | Citadel | 0.60% |
| SEMI | 3/30/22 | Columbia Seligman Semiconductor and Technology ETF | $41,928,853 | $3,767,150 | 21.97 | 5,555 | Fidelity Proxy | Virtu | 0.75% |
| CAPE | 4/5/22 | DoubleLine Shiller CAPE U.S. Equities ETF | $380,475,380 | -$95,997,600 | 8.68 | 40,569 | ActiveShares | Citadel | 0.65% |
| FMCX | 4/25/22 | FMC Excelsior Focus Equity ETF | $92,864,800 | $556,350 | 41.92 | 529 | ActiveShares | GTS | 0.70% |
| BYRE | 5/19/22 | Principal Real Estate Active Opportunities ETF | $10,187,299 | $1,357,560 | 22.85 | 981 | Fidelity Proxy | Virtu | 0.65% |
| JHAC | 11/2/23 | John Hancock Fundamental All Cap Core ETF | $3,438,089 | $682,316 | 10.25 | 1,138 | Fidelity Proxy | Virtu | 0.72% |
| Total/Average | $9,303,523,619 | $2,430,666,724 | 19.73 | 1,497,672 | 0.64% |
Source: Factset & NYSE Internal Database and Consolidated Tape Statistics as of 3/31/2024
*Simple average
Get NYSE's Active ETF Updates
Looking for data, insights, and commentary on the active ETF market?
Visit ETFCentral.com to hear directly from experts across the ETF community and access their intuitive ETF and Segment screener to find what’s resonating with investors.