2026 Q1 Earnings Preview
Seeing through the smoke
By: Michael Reinking | Sr. Market Strategist; Eric Criscuolo | Market Strategist
April 14, 2026
Key takeaways
- Q1 2026 S&P 500 EPS estimated +12.6% YoY — the 6th consecutive quarter of double-digit earnings growth
- Revenues estimated up 9.8%, the 22nd consecutive quarter of growth and highest growth rate since Q3 2022
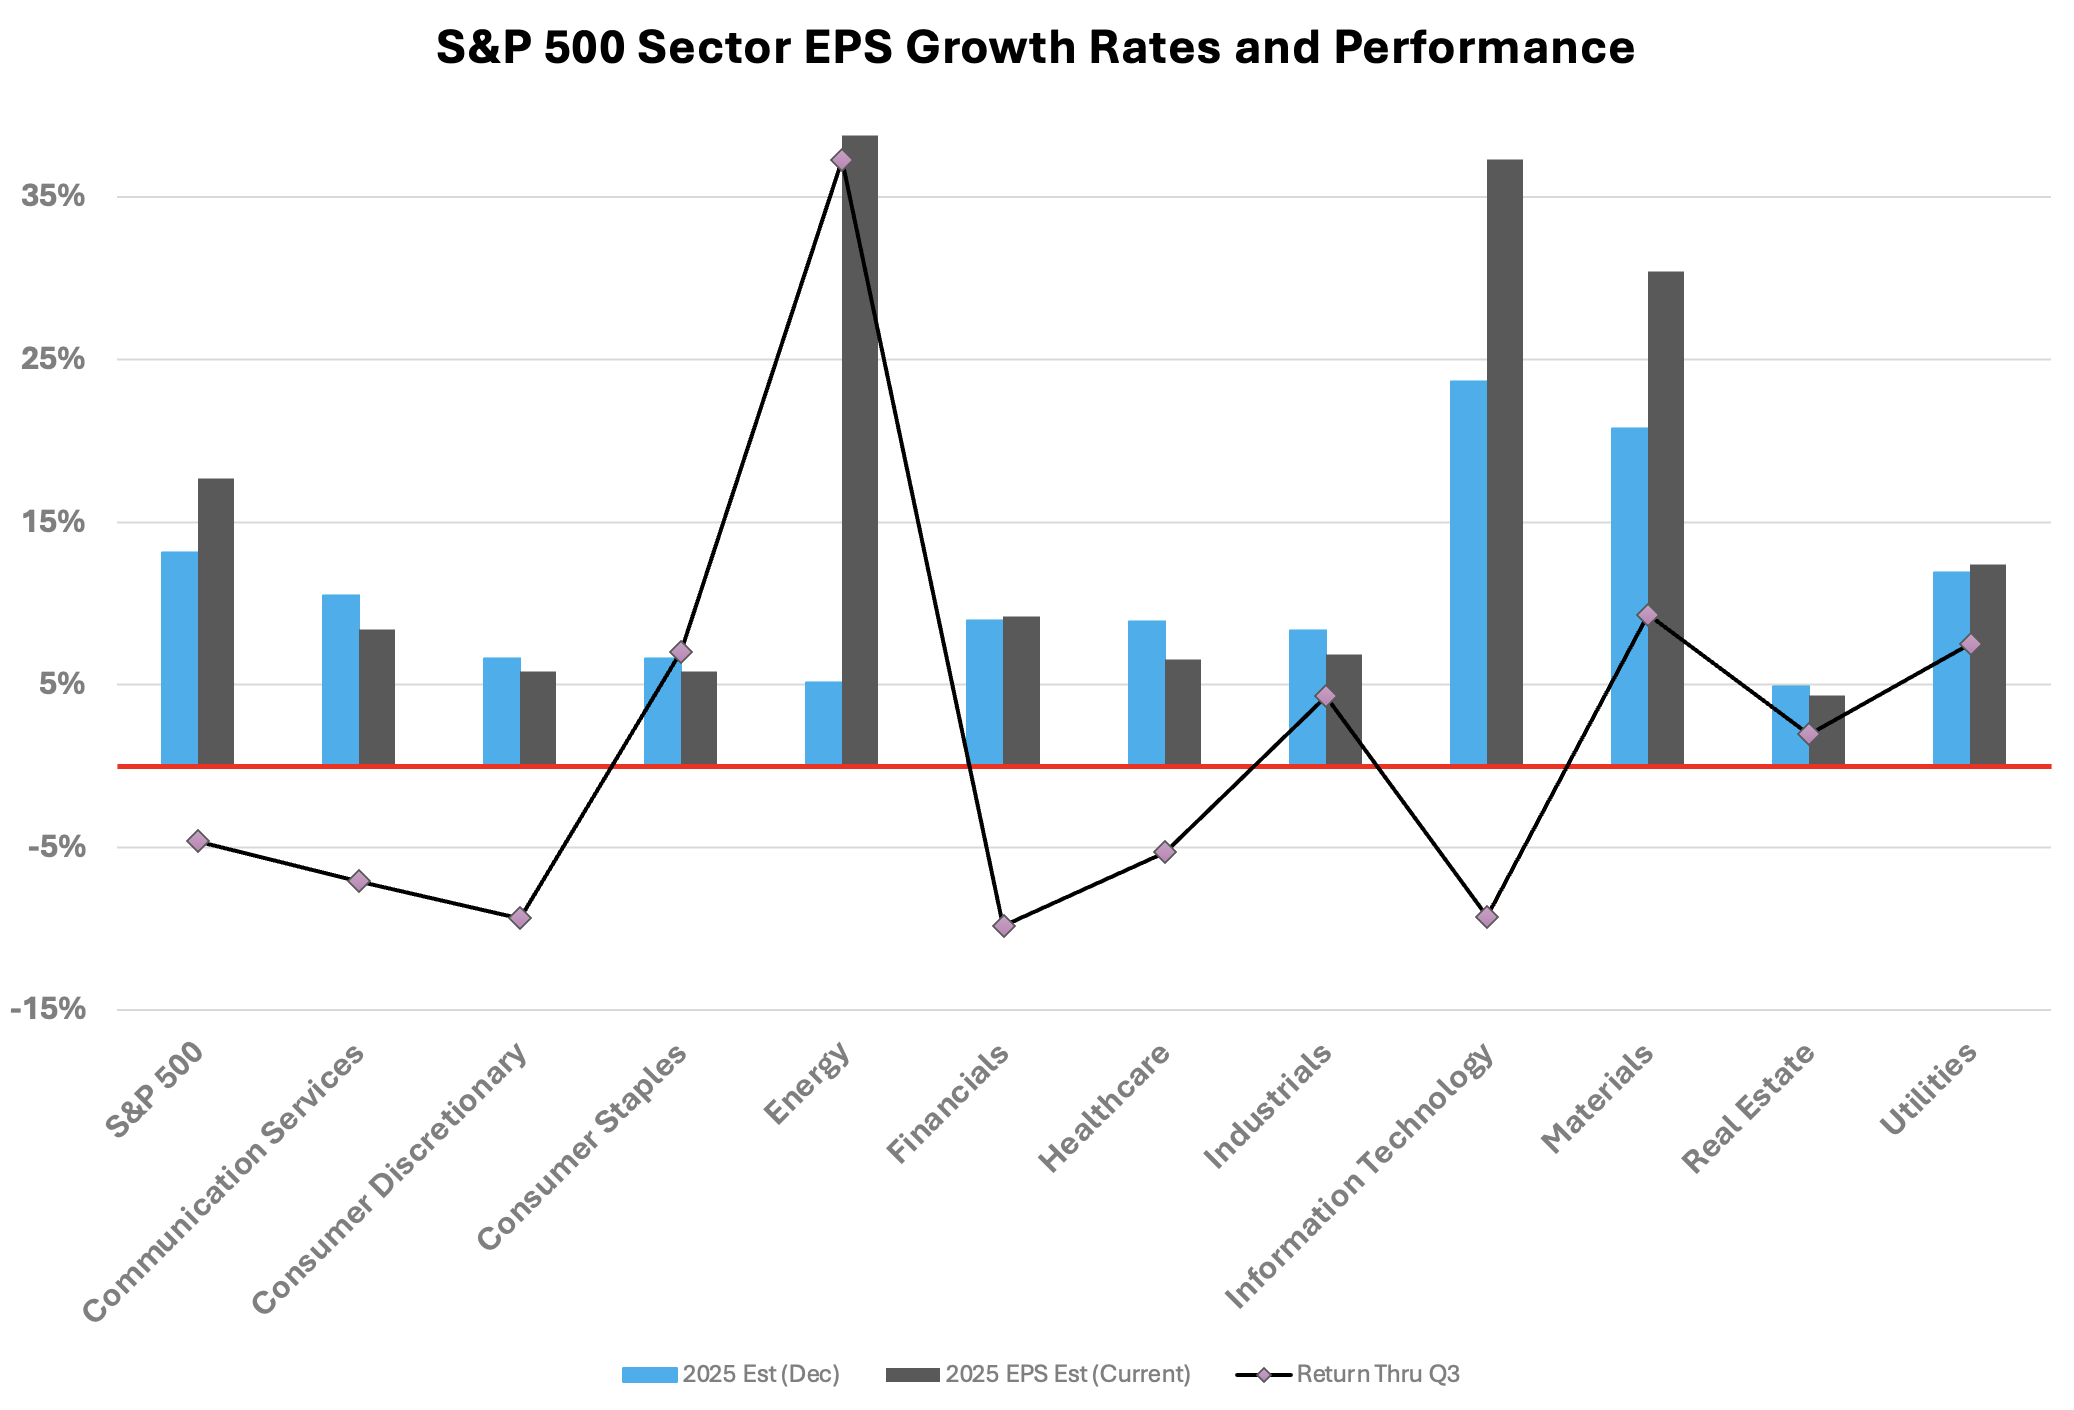
- EPS estimates moving higher driven by tech and energy
- Key topics: Geopolitical risk & energy prices, tariff pass-through, AI investment & monetization, margin durability and guidance in an uncertain macro environment
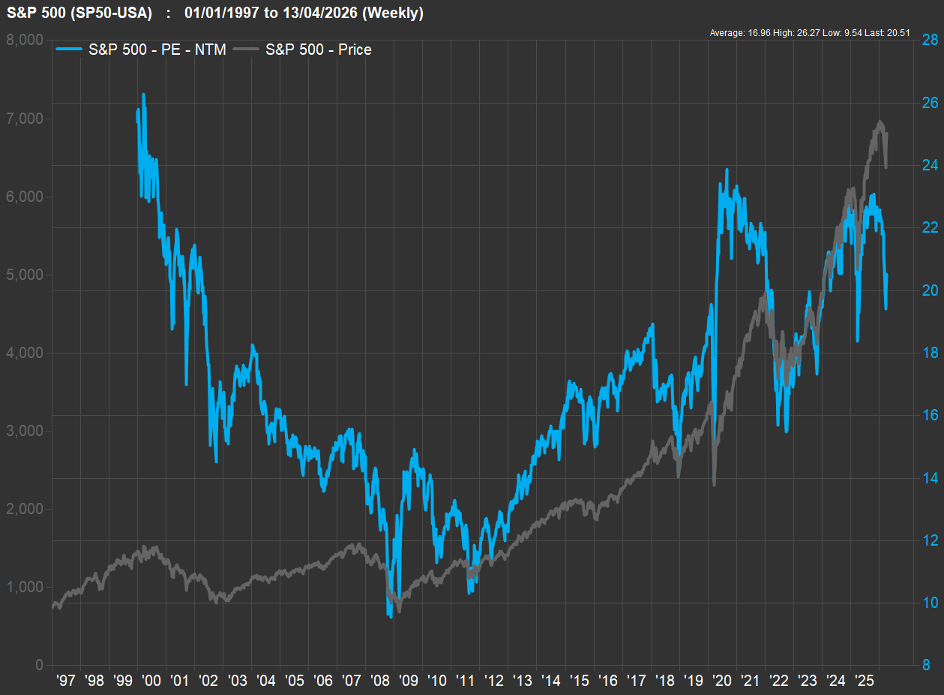
- Forward P/E has compressed to ~20x from >22x at year-end
What will investors be listening for on Conference Calls?
Geopolitical Risk, Tariffs, Energy Costs & Pricing
- How exposed is your supply chain to Middle East disruptions or commodity price volatility?
- Are higher energy costs impacting margins, and have you implemented new mitigation measures?
- Is the uncertainty affecting capital expenditure, hiring or inventory management decisions?
- Are there changes to the pricing strategy to offset the impact of tariffs and increased input costs?
AI Monetization & Efficiency
- What percentage of your capex or IT budget is being allocated to AI? Has that allocation changed?
- How is that being financed and has there been any change in access to capital?
- Do previously announced projects/investments remain on track? Is this being impacted by supply chain bottlenecks, access to energy, political pushback or increased costs?
- Can you point to concrete examples of AI driving productivity gains or revenue growth?
- To what extent is AI enabling headcount reductions?
- At what point does AI investment shift from a cost center to a measurable contributor to the income statement, and what metrics are you using internally to track that transition?
Guidance & Outlook
- Given macro uncertainty, are companies willing to maintain full-year guidance?
Financials
- What is the state of the consumer — are there signs that spending fatigue in lower income cohorts is spreading?
- Are there signs of credit quality deterioration, particularly in private credit or subprime?
- How is the uncertainty impacting investment banking activity?
Capital Allocation
- Do recent tax changes shift how you think about capital investment versus shareholder return programs?
Setting the Stage - A quick lookback at Q1
After three consecutive years of >15% gains, the S&P 500 was no stranger to defying gravity. There was another positive setup at the start of the new year: market breadth was finally improving as the average stock quietly outperformed the cap-weighted index, there was hope that fiscal and monetary policy tailwinds would help economic activity accelerate just as manufacturing data was showing signs of life. Through the first two months of the year, despite the S&P 500 hovering around unchanged the equal-weight version of the index and small and midcap indices were all up >5%. That’s not to say it was all rainbows and sunshine.
The questions that were raised at the end of 2025 about AI capex spending grew louder weighing on the mega-cap tech sector. So did the AI disruption concerns, as there seemed to be a step change in AI model improvements over the same time frame. Hundreds of millions of dollars of market capitalization were wiped out of sectors with the release of each new Claude Code plugin. Software, was hit the hardest with the expectation that customers would reassess vendor relationships, compress renewal cycles, and redirect IT budgets toward AI-native alternatives. This caused a re-valuation of the sector which fell nearly 25% during the quarter. This drawdown came to be known as the SAAS-Pocalypse and started to raise broader concerns.
At the end of last year, the bankruptcies of First Brands and Tricolor had shined the light on the fast-growing private credit industry. The opacity within the industry and exposure to the software sector stoked a round of redemption requests. As many of those requests exceeded limitations laid out in fund documentation they were scaled back, adding to some of the concerns and garnering more press coverage - creating a negative feedback loop.
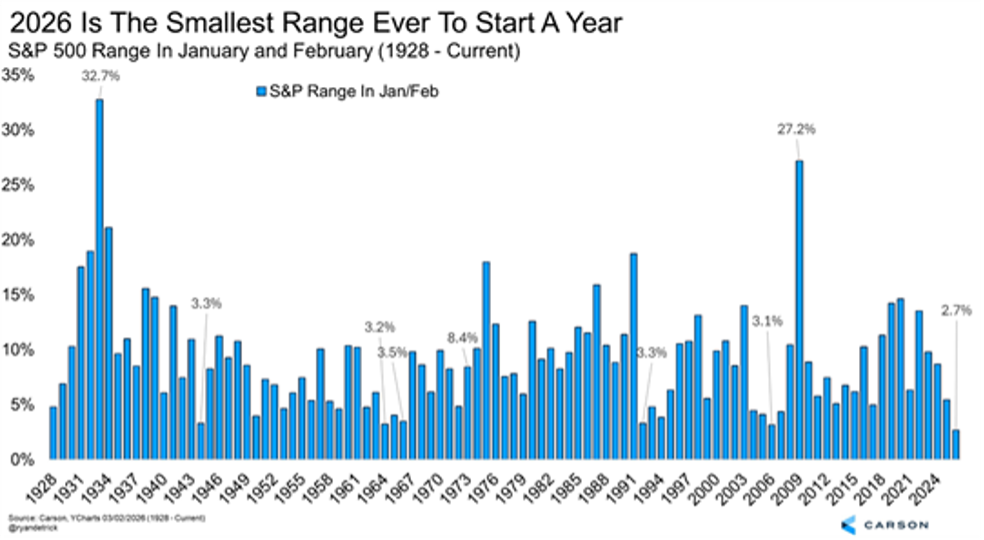
Q1 was clearly a stock pickers market, Ryan Detrick of Carson Group highlighted that the 2.7% range in the S&P 500 through the first two months of the year was the smallest ever. However, Barclays pointed out that the range for the average stock in the S&P 500 was about 7X that of the index, the largest ratio since they started tracking the data in 1994.
S&P 500 Trailing 3 Year Returns
Everything changed in March. In the final weeks of the quarter, escalating conflict in the Middle East effectively shuttered the Strait of Hormuz — the chokepoint through which >20% of global energy supply transits. Oil prices surged with ICE Brent topping $100. The implications were immediate and sweeping: inflation expectations spiked, the Federal Reserve's anticipated rate-cutting path evaporated nearly overnight, and Treasury yields climbed sharply even as economic data softened. Tax refunds that were expected to fuel additional consumer spending, or find its way into financial markets, was at best providing a buffer to help offset the energy shock.
This kicked off a broader de-risking within the marketplace with popular and crowded trades on both the long and short side of portfolios unwinding swiftly. The S&P 500 closed out the quarter amidst a five-week selloff falling 4.6% in Q1 - its worst performance since Q3 2022. Small and mid-caps also gave up a good portion of the aforementioned gains. International markets, which had outperformed throughout the start of the year began to underperform given the reliance on energy from the region. There continues to be quite a bit of dispersion beneath the surface but the overall drawdowns have been reasonably muted as compared to the tariff-related losses during Q1 of last year.
At the end of the quarter equity markets began to bounce as there were signs that the administration was looking for an offramp and diplomatic channels reopened, ultimately leading to a bounce of the lows. It is a complicated backdrop heading into earnings season with investors turning to corporate commentary to better understand how the recent energy shock and tremors in credit markets is impacting the overall macro backdrop. (Prices below through close of trading on 4/13/26)
Inside the Numbers - Data compliments of FactSet Earnings Insight as of April 10, 2026
Q4 2025 Review
- Q4 S&P 500 earnings +13.4% YoY vs. 8.3% estimate — 4th consecutive quarter of double-digit growth
- 83% of companies beat analyst estimates
- Q4 Revenue +9.2% (vs. 7.7% est.) — 21st consecutive quarterly increase
Q1 2026 EPS Estimate: +12.6% YoY
- Top-growing sectors: Info Tech (+45.0%), Materials (+24.2%), Financials (+15.1%), Utilities (+9.6%)
- Declining sectors: Health Care (-9.8%) and Comm Services (-3.3%)
- Percentage of companies issuing positive guidance above historical averages (53% vs. 5/10yr avg. of ~40%)
Q1 2026 Revenue Estimate: +9.8% YoY
- Highest projected revenue growth rate since Q3 2022; all 11 sectors expected to grow revenues
- Leaders: Info Tech (+27.4%), Comm. Services (+12.8%), Financials (+10.0%)
Q1 2026 Net Profit Margin Est.: 13.2%
- Flat vs. last quarter (13.2%) and above year-ago (12.8%) and 5-year average (12.2%)
Valuation
- Forward 12-month P/E: 20.4x — above 5-yr avg. (19.9x) and 10-yr avg. (18.9x) but down from 22.0x at year-end
Looking Ahead: Full-Year 2026 Outlook
| Quarter | Q1 2026E | Q2 2026E | Q3 2026E | Q4 2026E |
|---|---|---|---|---|
| EPS Growth (YoY) | +12.6% | +19.7% | +21.8% | +19.6% |
| Revenue Growth (YoY) | +9.8% | +10.1% | +9.1% | +8.7% |
CY 2026: EPS growth estimate +17.6%, revenue growth estimate +9.0%
The Big Picture
When Q4 2025 earnings wrapped up, the dominant narrative was that corporate America had yet again defied gravity. Through tariff turbulence, a government shutdown, AI spending scrutiny, and three years of above-average equity gains, management teams delivered four consecutive quarters of double-digit earnings growth. The setup for 2026 looked constructive: the OBBBA's tax incentives were beginning to flow through, AI infrastructure investment was accelerating, and the earnings gap between mega-cap tech and the rest of the market had started to narrow.
Investors now face the Q1 reporting season with a more complicated backdrop. The quarter itself is a bifurcated story: a solid first two months, then a macro shock that compressed sentiment, pushed energy costs higher, and injected genuine uncertainty into corporate cost structures and demand outlooks. The Street remains optimistic with estimates moving higher throughout much of the quarter. The corporate commentary, pre-announcements and companies reporting very early in the cycle suggest that the numbers will once again be positive, likely extending the double-digit growth rates for S&P 500 earnings to six quarters.
The continued upward trajectory of earnings estimates does set a high bar for markets. Given the geopolitical situation, which remains very much influx, likely leads to a cautious tone from management teams. Investors will be listening closely to see if there was a meaningful change on the demand side of the equation as the conflict ramped up. Just as importantly they will also be looking for guidance from companies in terms of how they are managing the increase in input costs, supply chain disruptions and pricing strategies.
Cross currents are impacting industries in different ways and there are clear hot button issues to be on the lookout for. Financials lead us out of the gate and have a unique vantage point. Capital markets and investment activity got off to a good start but did slow heading into the end of the quarter. Pipelines are still viewed as very healthy but some of that activity is likely pushing into the back half of the year. Initially the volatility likely helped the trading side of the businesses pick up some of the slack though it does feel like this is giving way to some paralysis. This sector will give us some insight into the state of the consumer and impact on spending trends. Credit quality is also going to be a big topic of conversation.
The AI investment cycle has been the primary driver of the positive pre-announcements primarily in semis, memory and other hardware. The tech sectors accounts for over half of the positive pre-announcements this quarter, with earnings estimates for Q1 increasing by over 10% since the start of the year to ~45%. That increase even outpaces the positive revisions for the energy sector, which was a distant second. Given the positive pre-announcements there probably isn’t much more to come but the commentary about the demand environment won’t likely waver.
Obviously, software is in a different situation, broadly speaking the numbers for the sector last quarter were reasonably solid and did help to provide a bit of a reprieve to some of the weakness though commentary about longer sales cycles did raise concerns. Management teams have a difficult task in front of them as they try to break the current narrative with investors also listening to companies outside of the sector as it relates to headcount, IT capex budgets and how that is being allocated.
The valuation picture has improved. Analysts EPS growth estimates have increased to 18% in 2026 up from ~13% at the start of the year. Around the end of the quarter when the S&P 500 was near the lows the forward P/E was ~19X about inline with the 10yr average and down from >22X at the end of last year. Over the last six months the index is largely unchanged so you could describe this as a correction via time not price and arguably the multiple compression reflects some of the geopolitical uncertainty. The estimates are clearly optimistic, suggesting that the geopolitical shock will be transitory, though the situation is still in flux. Oil prices, while off their highs, are still elevated. This reporting season feels more like marking time with investors largely on the look out for red flags rather than rewarding companies for solid performance.
Corporate America has earned the benefit of the doubt over the past five years. Management teams have navigated a pandemic, a historic rate cycle, a tariff war, and a government shutdown without breaking stride. This quarter, the smoke is real — but so is the earnings power underneath it.